Reports is UCLIQ's main analytics tool. You can view statistics on traffic, conversions, revenue, and expenses across 11 tabs.
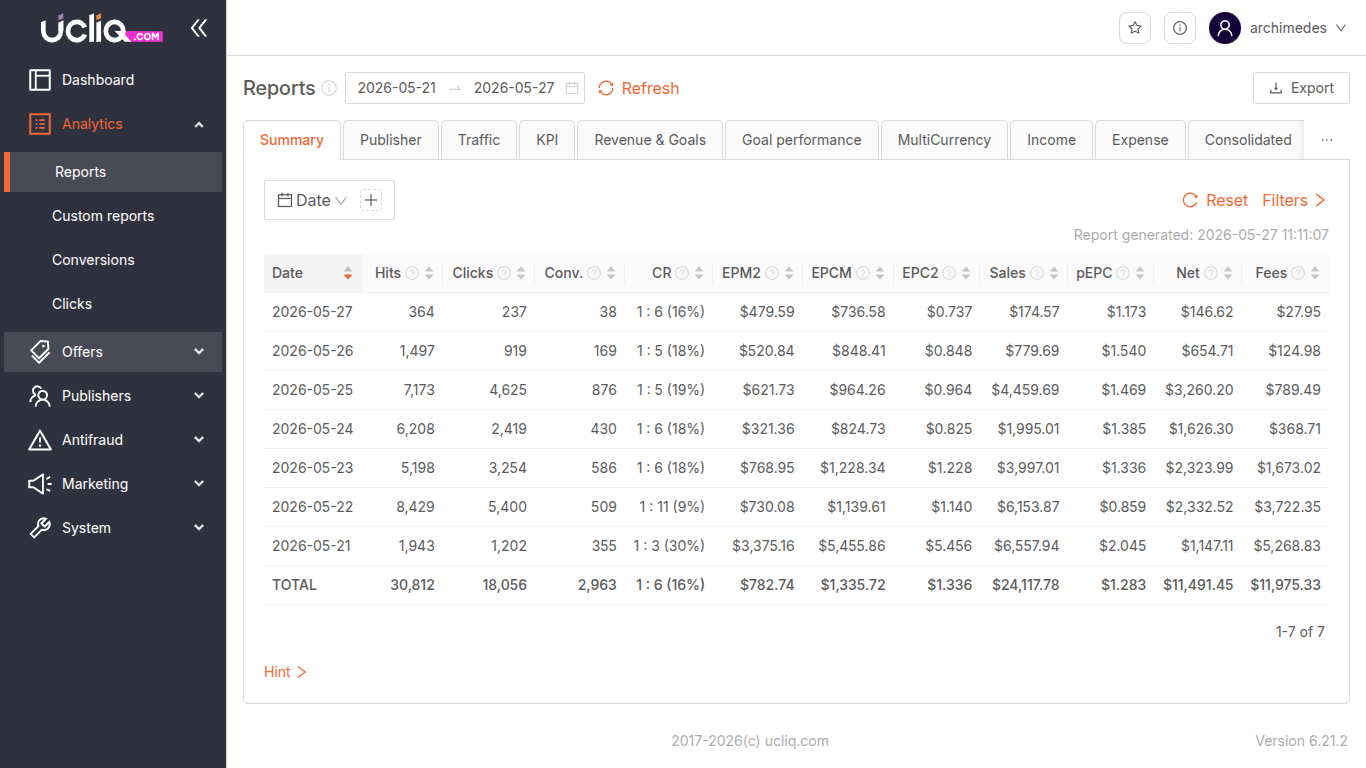
Date range
By default, the report shows data for the last 7 days. Change the period using the calendar or quick presets: Last 3 months, Last 30 days, Last 7 days, Today. Click Refresh after changing the period.
All dates and times follow the timezone set in Control Center → General → Local → Timezone.
Filters
Click Filters on the right to narrow data by publishers, offers, countries, and other parameters. All conditions use AND logic. Available filters:
Publishers, Publisher aliases, Offers, Countries, Advertiser accounts, Targets, Subsource, Domain, Smartlinks, Smartlink campaigns, Funnels, Funnel campaigns, Tags, Source (Any / Offer / Funnel / Smartlink).
A More filters button reveals additional options. Click Apply to confirm, Reset to clear.
Grouping (aggregation)
Data is grouped by day by default. Change the base period (Hour, Day, Week, Month, Year) using the dropdown next to Date.
Multi-level aggregation: Click the + next to Date to add grouping levels. For example, group by day then by country. Data appears as nested rows.
Available options depend on the tab. Summary offers ~30 options including Bots. Publisher has the same minus Bots. Other tabs have their own sets.
Consolidated, Trends, and MultiCurrency do not support additional grouping.
Table columns
Columns are sortable — click a header. Each column has a tooltip. The + button adds extra columns. Entity names (offer, publisher, country) are clickable: click to filter, click the link icon to open the entity's dashboard.
Export
Download data as XLSX (Excel) on Summary, Income, and Consolidated tabs only.
The report shows the first 1000 entries. Narrow the period or add filters to see more.
Report tabs
Summary
Daily metrics: Hits, Clicks, Conv., CR, EPM2, EPCM, EPC2, Sales, pEPC, Net, Fees.
Publisher
Per-publisher stats: Hits, uHits, Clicks, uClicks, Conv., CR, pEPC, EPM, Net.
uHits/uClicks are unique per session (cookie-based).
Traffic
Traffic quality: Bots, Hits, uHits, fHits, Clicks, uClicks, Hosts, CR, HR.
HR = unique hosts / unique clicks × 100. fHits = failed impressions.
KPI
Key indicators with declines and adjustments: Hits, Clicks, Conv., Decl. (count), Adj. (count), EPM2, EPC2, Sales, Decl. ().
Revenue & Goals
Profitability: Conv., Sales, Decl., Adj., Net, Fees, Refer. (referral), Net fees, ROI.
Goal Performance
Goal effectiveness. Requires goal configuration in offers.
MultiCurrency
Cross-currency summary in original currencies.
Income
Revenue breakdown.
Expense
Cost breakdown: payouts, fees, ROI.
Consolidated
Advertiser conversions vs publisher payouts side by side.
Trends
Metric trends over 30d, 7d, 1d.
Metric definitions
The Hint button at the bottom shows definitions for the active tab.
Summary:
-
Events: Hits* (tracking link impressions), Clicks* (offer page visits), Conv.** (CPS/CPC sales)
-
KPI: pEPC (avg per unique click), EPC2** (avg per click), EPCM** (avg per 1000 clicks), EPM2** (avg per 1000 impressions)
-
Revenue: Sales (postbacks excl. declines/adjustments), Net (publisher revenue), Fees (platform commission)
Publisher:
-
Events: Hits*, uHits* (unique), Clicks*, uClicks* (unique), Conv.**
-
KPI: CR** (unique clicks to conversions ratio), pEPC, EPM**
-
Revenue: Net
Traffic:
-
Events: Hits*, uHits*, fHits* (failed), Clicks*, uClicks*, Hosts* (unique IPs)
-
KPI: CR** (all clicks to conversions ratio), HR** (Host Ratio)
KPI:
-
Events: Hits*, Clicks*, Conv., Decl. (declines), Adj.
-
KPI: EPC2**, EPM2**
-
Revenue: Sales, Decl. ()
Revenue & Goals:
-
Events: Conv.**
-
Revenue: Sales, Net, Decl., Adj., Fees, Refer., Net fees, ROI
Hits, Clicks, uHits, uClicks are counted on the date they occurred.
**Conversions, CR, EPM, EPC2, EPCM are counted on the conversion date.