The Fraud Monitoring dashboard provides a high-level overview of suspicious activity across all conversions. It helps you detect fraudulent traffic patterns, understand why conversions are being declined, and take action — whether that means blocking traffic sources or tightening conversion checks.
Dashboard Overview
The dashboard is organized into four key sections, each designed to surface different dimensions of fraud activity.
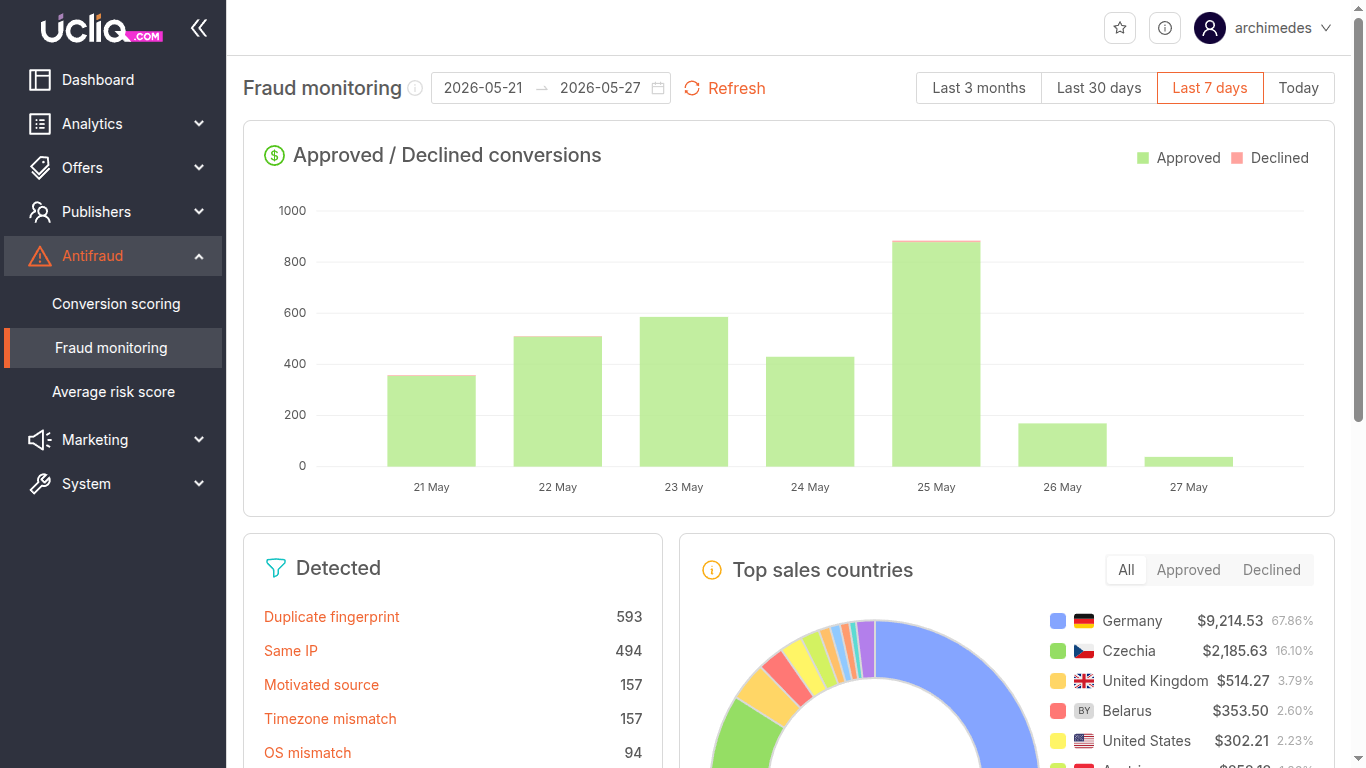
Approved / Declined Conversions
A line graph at the top of the dashboard shows the number of approved (green) and declined (red) conversions over the selected period. This trend view helps you spot sudden changes in traffic quality — a spike in declined conversions often signals an active fraud attempt.
Detected Fraud Indicators
This section lists every fraud detection trigger with a count of how many times it fired in the selected period. Each indicator links directly to a filtered view in Conversion Scoring so you can inspect the affected conversions.
Top Sales Countries
A circular chart breaks down traffic by country. Toggle between:
-
All traffic
-
Approved conversions only
-
Declined conversions only
Use this to quickly identify regions with disproportionately high fraud rates.
Top 10 Suspicious Offers
A table listing up to ten offers or publishers with the highest levels of suspicious activity. Switch between Offers and Publishers view. Each row shows the number of conversions and the decline rate. Click a row to expand the risk type breakdown.
Fraud Indicators — Full Reference
Every conversion is checked against a set of deterministic heuristics. When a heuristic triggers, it adds to the conversion's risk score and appears in the Fraud Monitoring dashboard under the matching indicator.
Duplicate Fingerprint
Multiple conversions share the same browser fingerprint hash. Legitimate users rarely produce identical fingerprints — this usually indicates automated tools or click farms reusing the same browser profile.
Same IP
Multiple conversions originating from the same IP address. While a shared IP (office, university) can be legitimate, a high count across unrelated publishers strongly suggests click fraud.
Motivated Source
Traffic flagged as incentivized — the User-Agent or Referrer header contains markers from social or incentive platforms (e.g., kik.com, snapchat). Incentivized traffic typically converts at low quality and high refund rates.
Timezone Mismatch
The browser fingerprint reports a different timezone than the GeoIP lookup. For example, a user whose browser says "Europe/London" but whose IP is geolocated to "Asia/Manila". This often indicates proxy or VPN use.
OS Mismatch
The operating system reported by the browser differs from the OS detected by fingerprinting. Example: the browser claims "Windows 10" but the fingerprint reveals "Windows 7 or 8". This is a common sign of emulated devices.
Language Mismatch
The browser's Accept-Language header (e.g., en-US) does not match the expected language for the conversion's country. A weak signal on its own, but meaningful when combined with other mismatches.
Connection Type Mismatch
The connection type detected (e.g., "Corporate") is unusual for the offer vertical. Corporate IPs rarely convert for consumer offers, so this flags traffic that may be coming from a controlled environment.
Autonomous System Mismatch
Traffic originates from an IP address registered to a known data centre or cloud provider (DigitalOcean, AWS, Hetzner, etc.). Legitimate consumer traffic rarely comes from data centre ASNs — this is a strong fraud signal.
Touch Support Mismatch
An Android device reports empty or incomplete touch support data. Real Android devices always have full touch capability — missing touch data strongly suggests a desktop emulator running an Android browser profile.
Using the Dashboard
Fraud Monitoring is designed as a triage tool. Recommended workflow:
-
Check the Approved/Declined chart — if the decline rate has jumped, investigate.
-
Review Detected indicators — sort by count to find the most active fraud vector.
-
Check Top Sales Countries — toggle to "Declined only" to see if fraud is concentrated in specific regions.
-
Inspect Top 10 Suspicious Offers/Publishers — drill into specific offers or publishers with high decline rates. Click a row to see which fraud indicators triggered for that entity.
-
Take action — from the drill-down, link directly to Conversion Scoring to approve, decline, or investigate individual conversions.
The dashboard uses a customizable date range. Quick presets: Today, Last 7 days, Last 30 days, Last 3 months. Use Refresh to reload after changing filters.