The Analytics section provides statistical data about how the platform is performing. You can access the following dashboards:
Reports
Conversions
Clicks
Reports
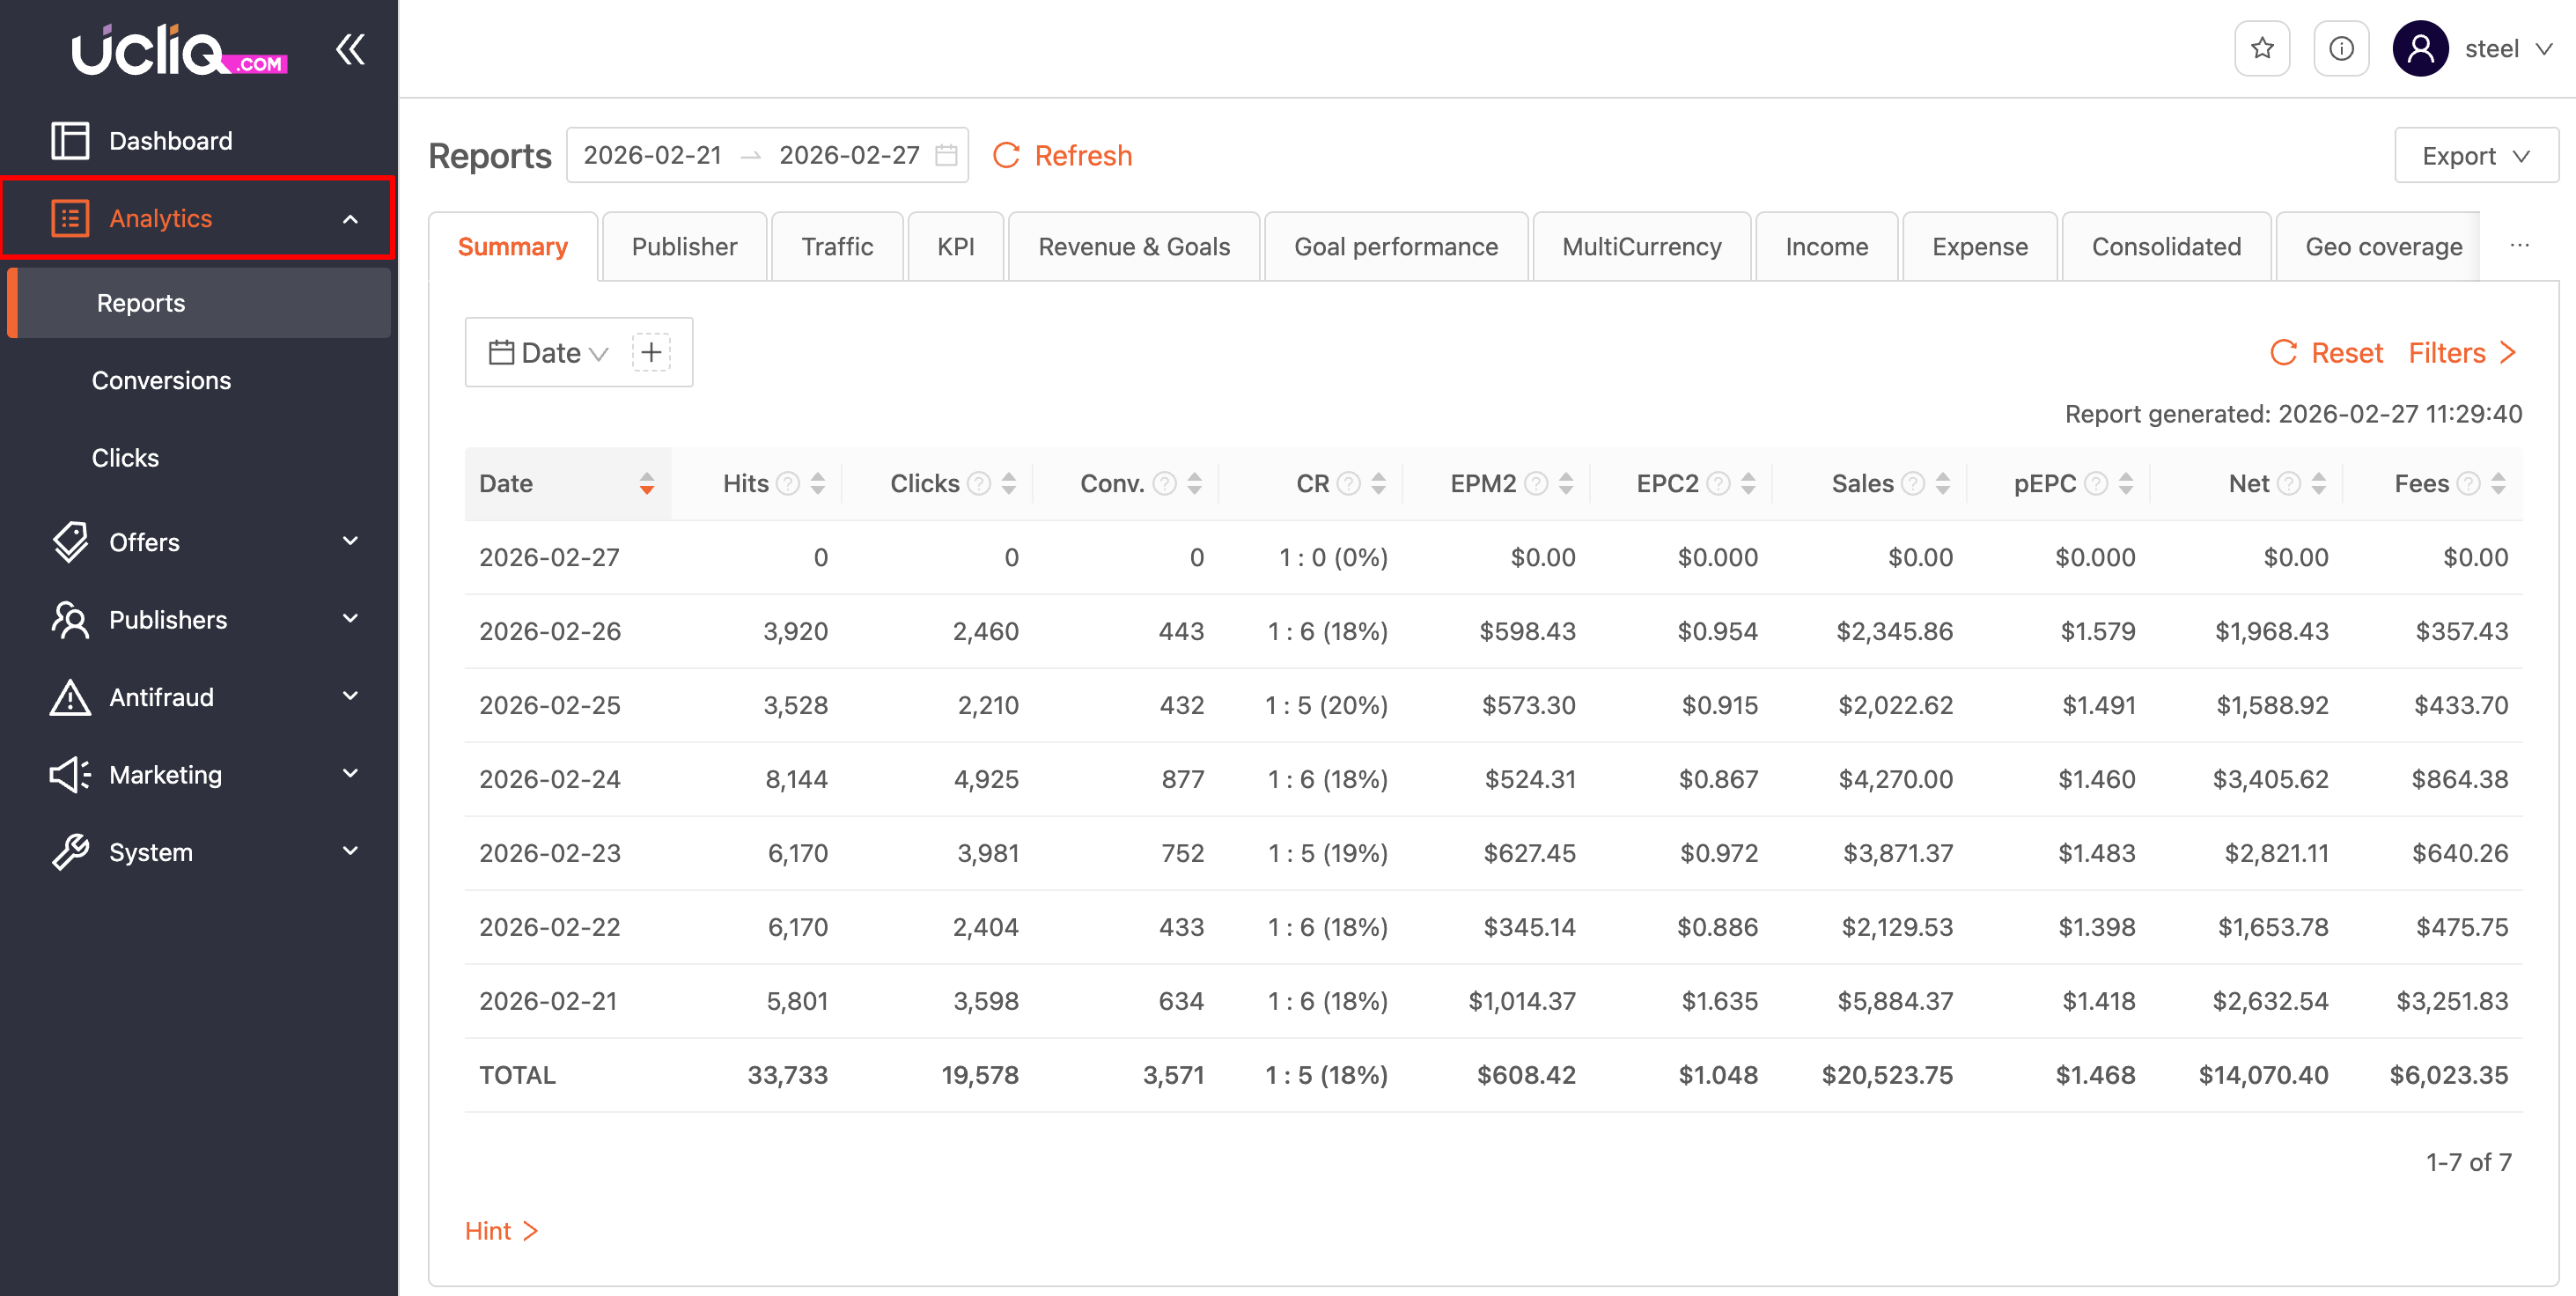
There are different types of reports available:
-
Summary – displays key performance indicators (KPIs)
-
Publisher – shows statistics for each publisher (as shown in the publisher panel)
-
Traffic – provides detailed traffic reports
-
KPI – offers detailed statistics on key performance indicators
-
Revenue and Goals – shows profit and goal-related statistics
-
Performance – alternative performance indicator calculations
-
Consolidated – compares conversions from advertisers with payments to publishers
-
Geo Coverage – shows traffic statistics by geography
-
Publisher Trends – compares publisher statistics over time
-
Budget – shows publisher balances by budget
To view statistics on key indicators, go to Analytics > Reports. This report aggregates the data over the selected time period.
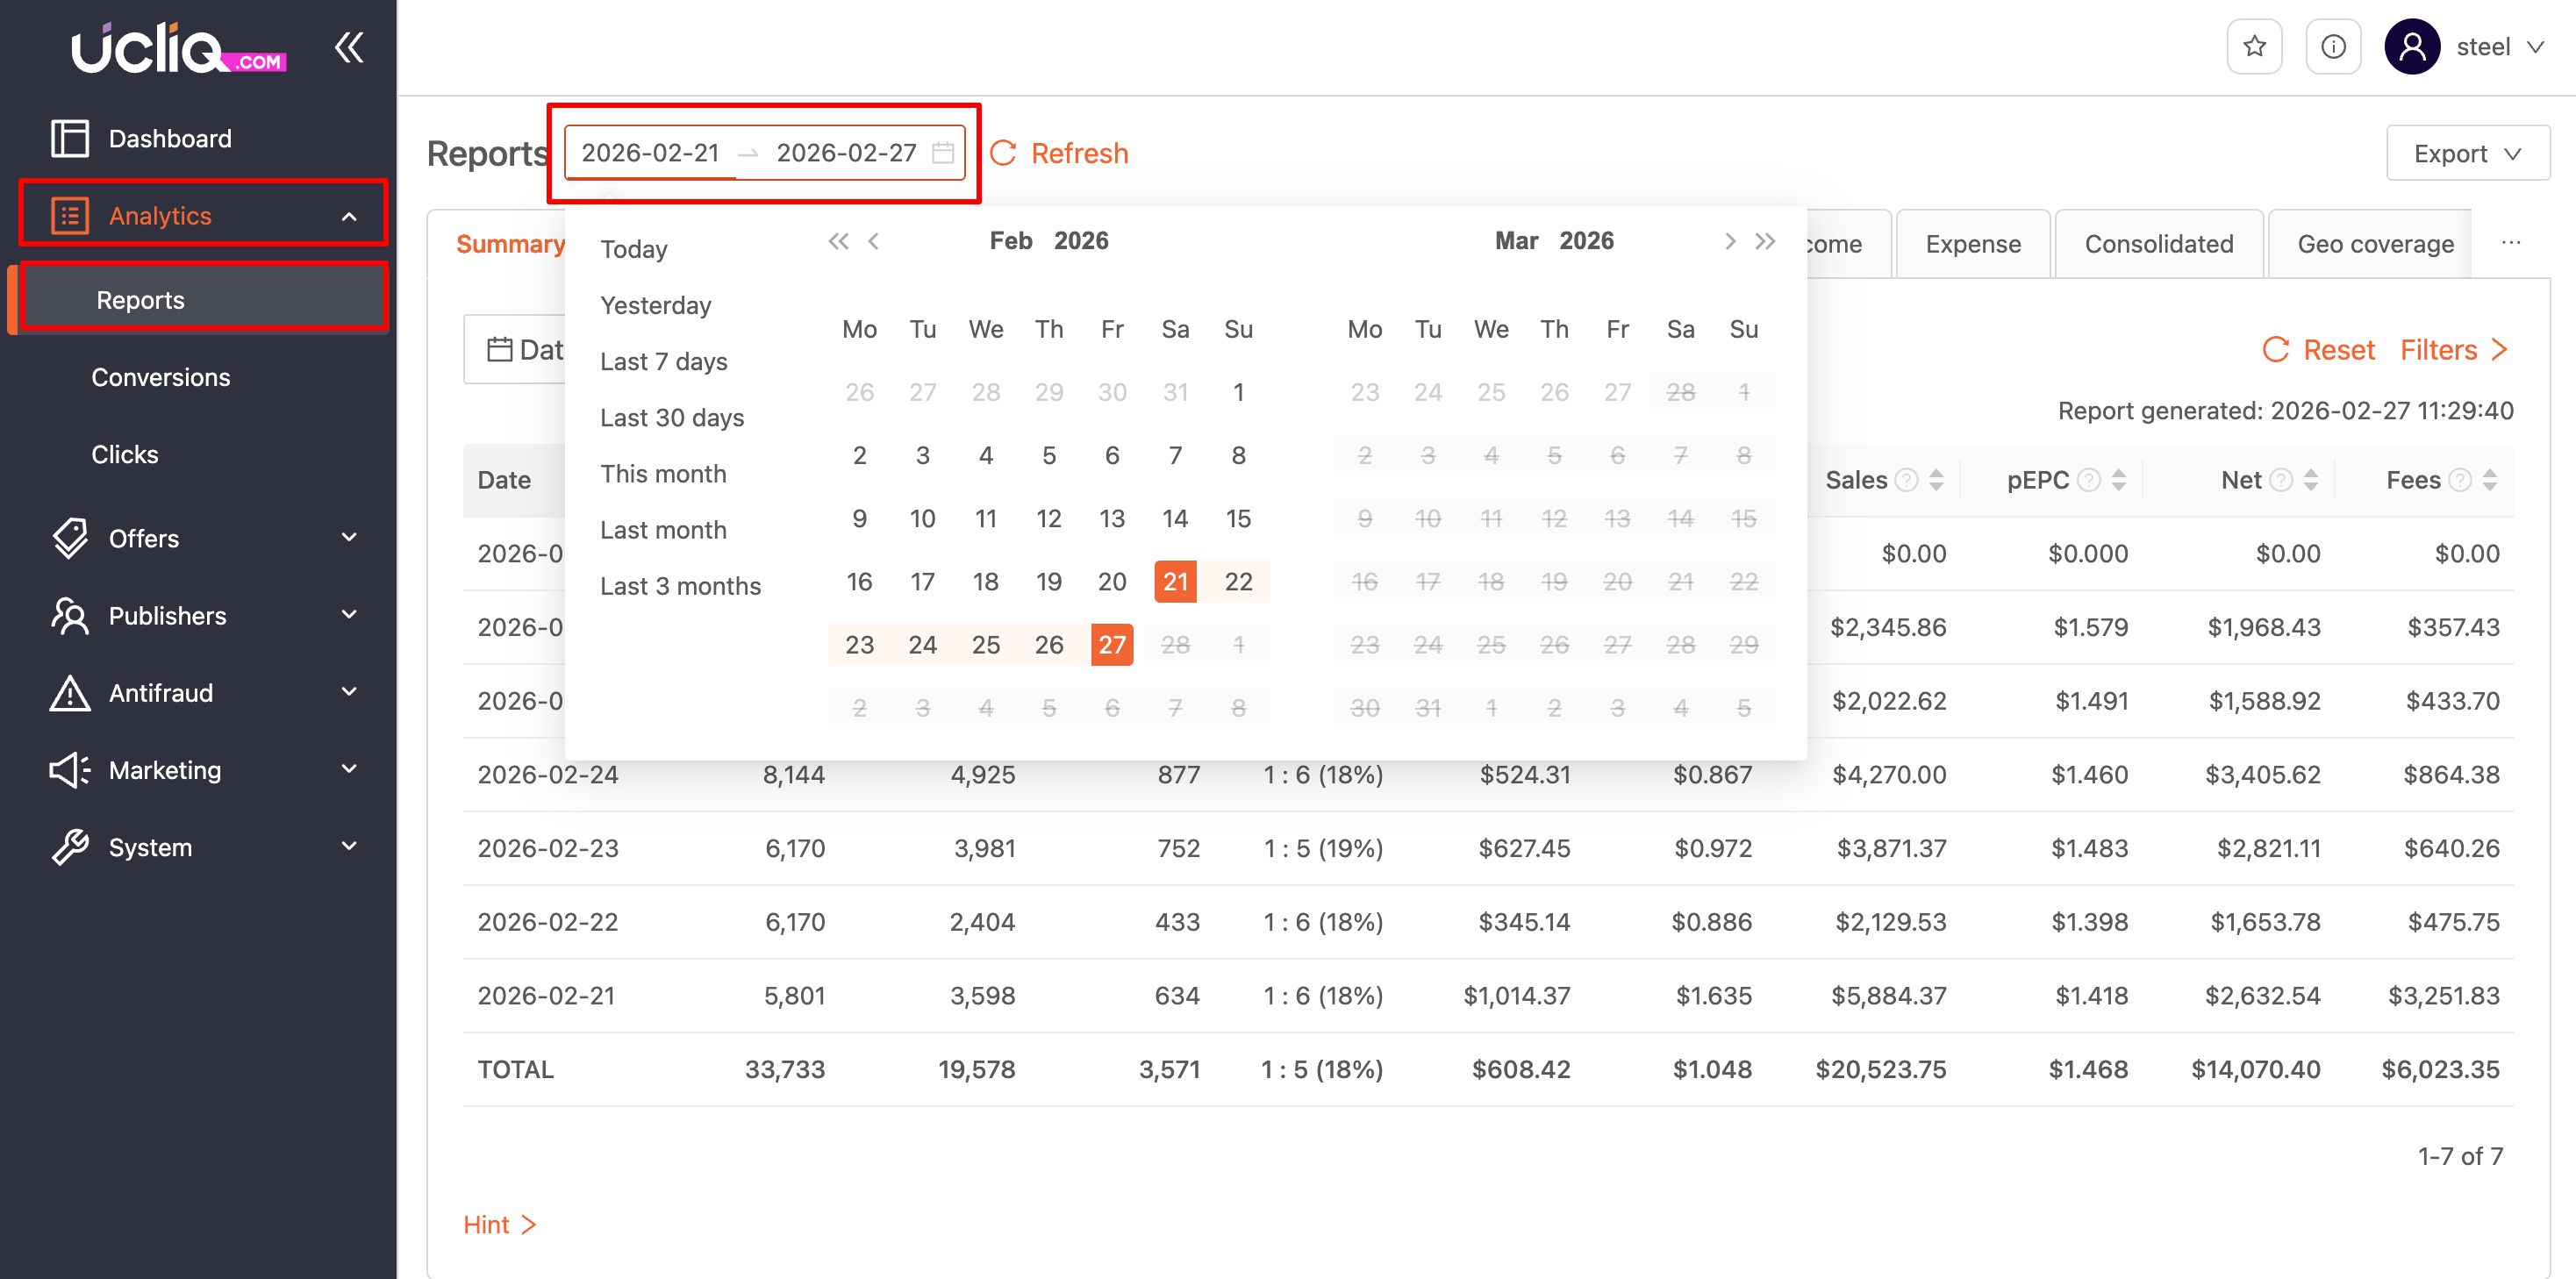
Calendar and date selection
You can choose a preset date range or set a custom date period for your report. Keep in mind that only the first 1000 entries will be shown. Narrowing the date range or applying filters can help get complete data. After selecting the desired date range, click the “Update” button to apply the changes.
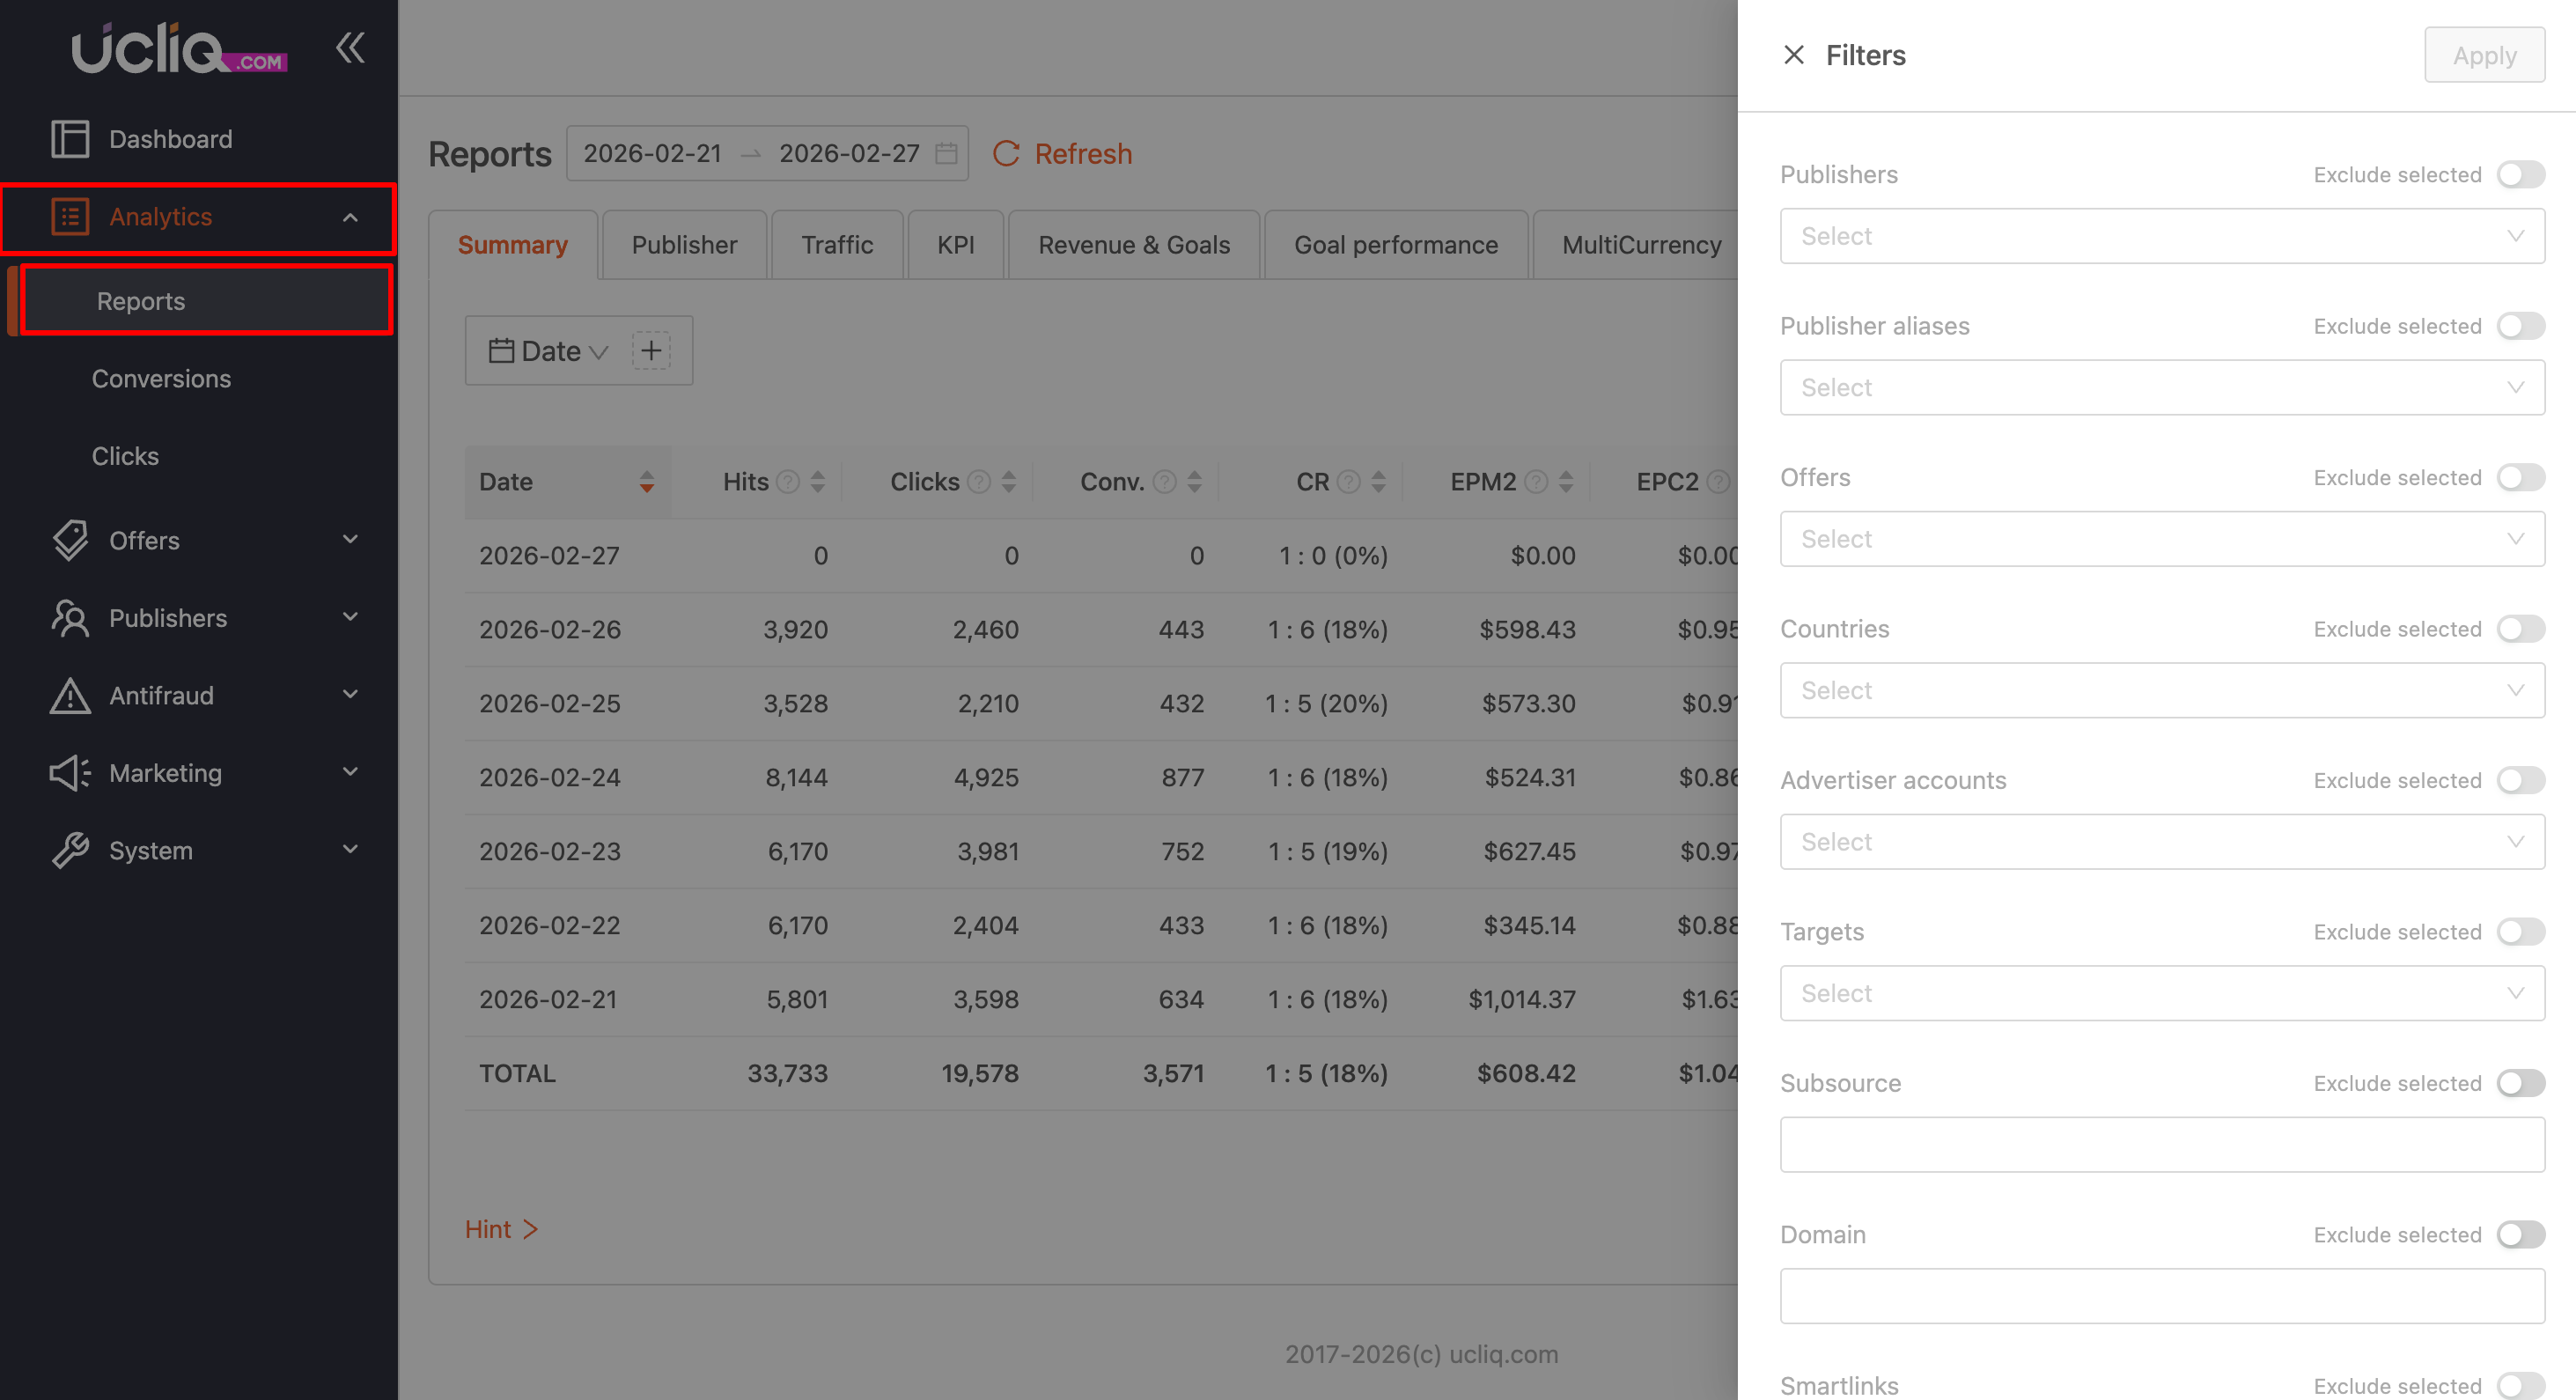
Applying filters
Filters help you narrow down the data in the report. All selected parameters must match the data, meaning that the data will be filtered using an “AND” approach. After selecting the filters, click the “Apply” button to update the report.
Using aggregation (grouping)
By default, the data is grouped by days (if you select a range of several days) or by hours (if you select one day). You can change the grouping by clicking the arrow next to the aggregation parameter name. Additionally, you can add two more aggregation parameters.
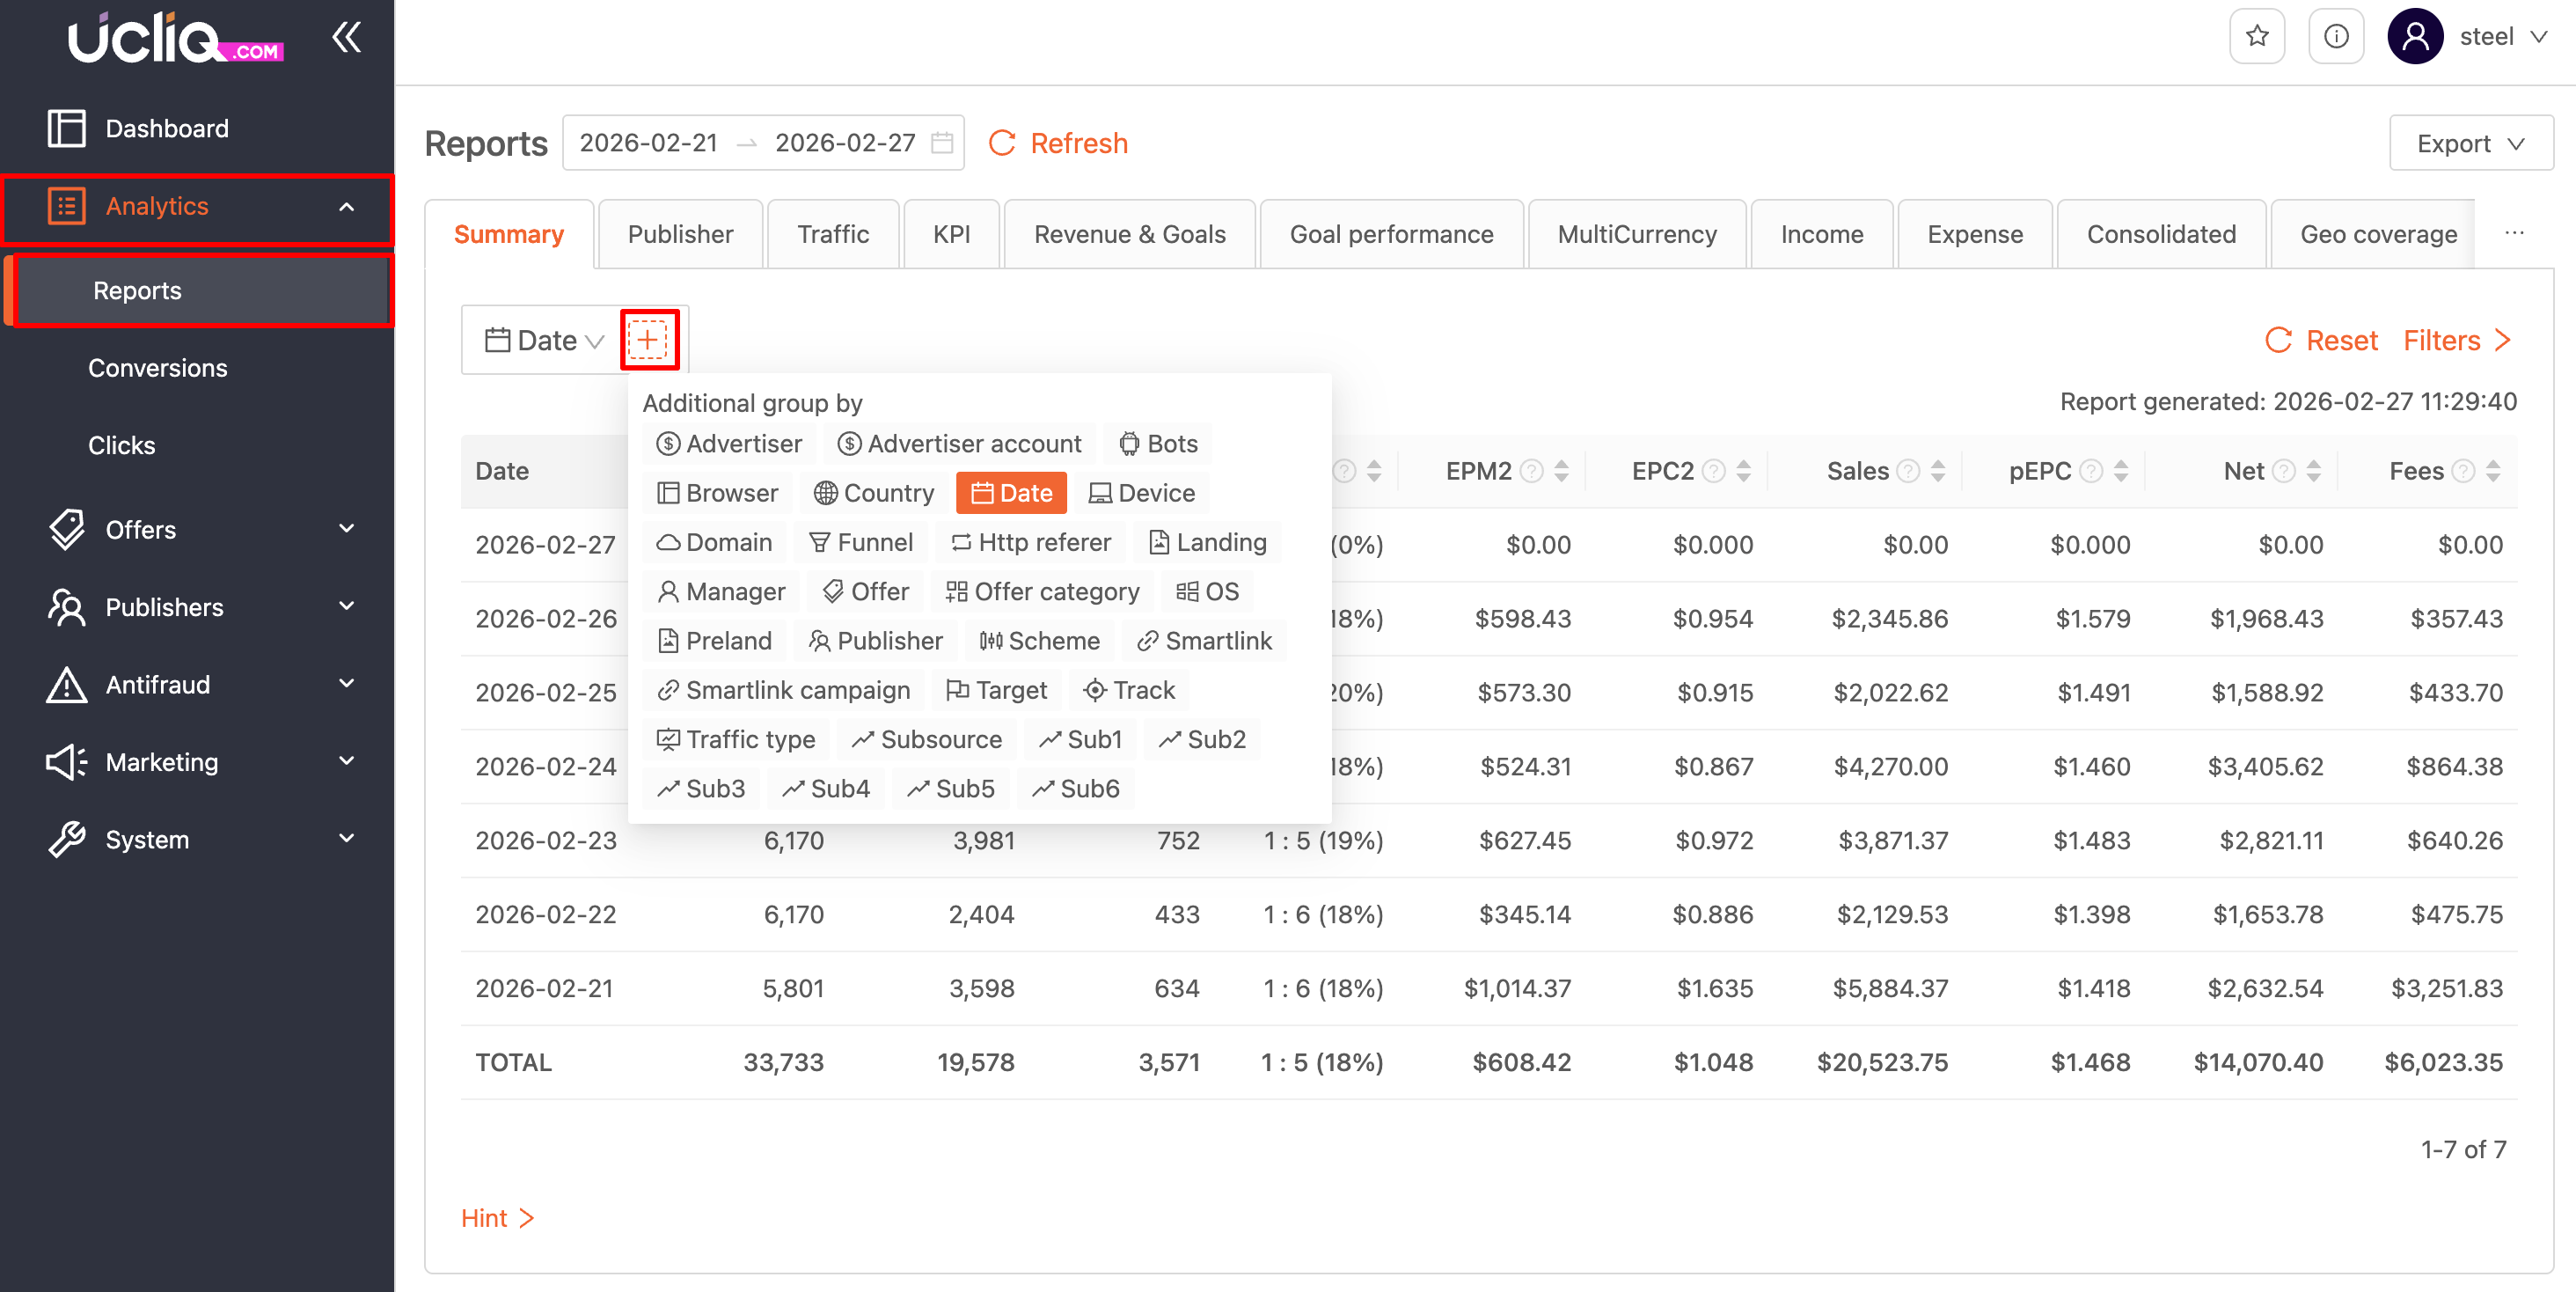
Aggregation options include:
-
Advertiser
-
Advertiser account
-
Bots
-
Browser
-
Country
-
Date/Hour
-
Device
-
Domain
-
HTTP referrer
-
Offer
-
Offer category
-
OS
-
Preland
-
Publisher
-
Smartlink
-
Smartlink campaign
-
Track
-
Traffic type
-
Subsource
-
Sub(1,2..6)
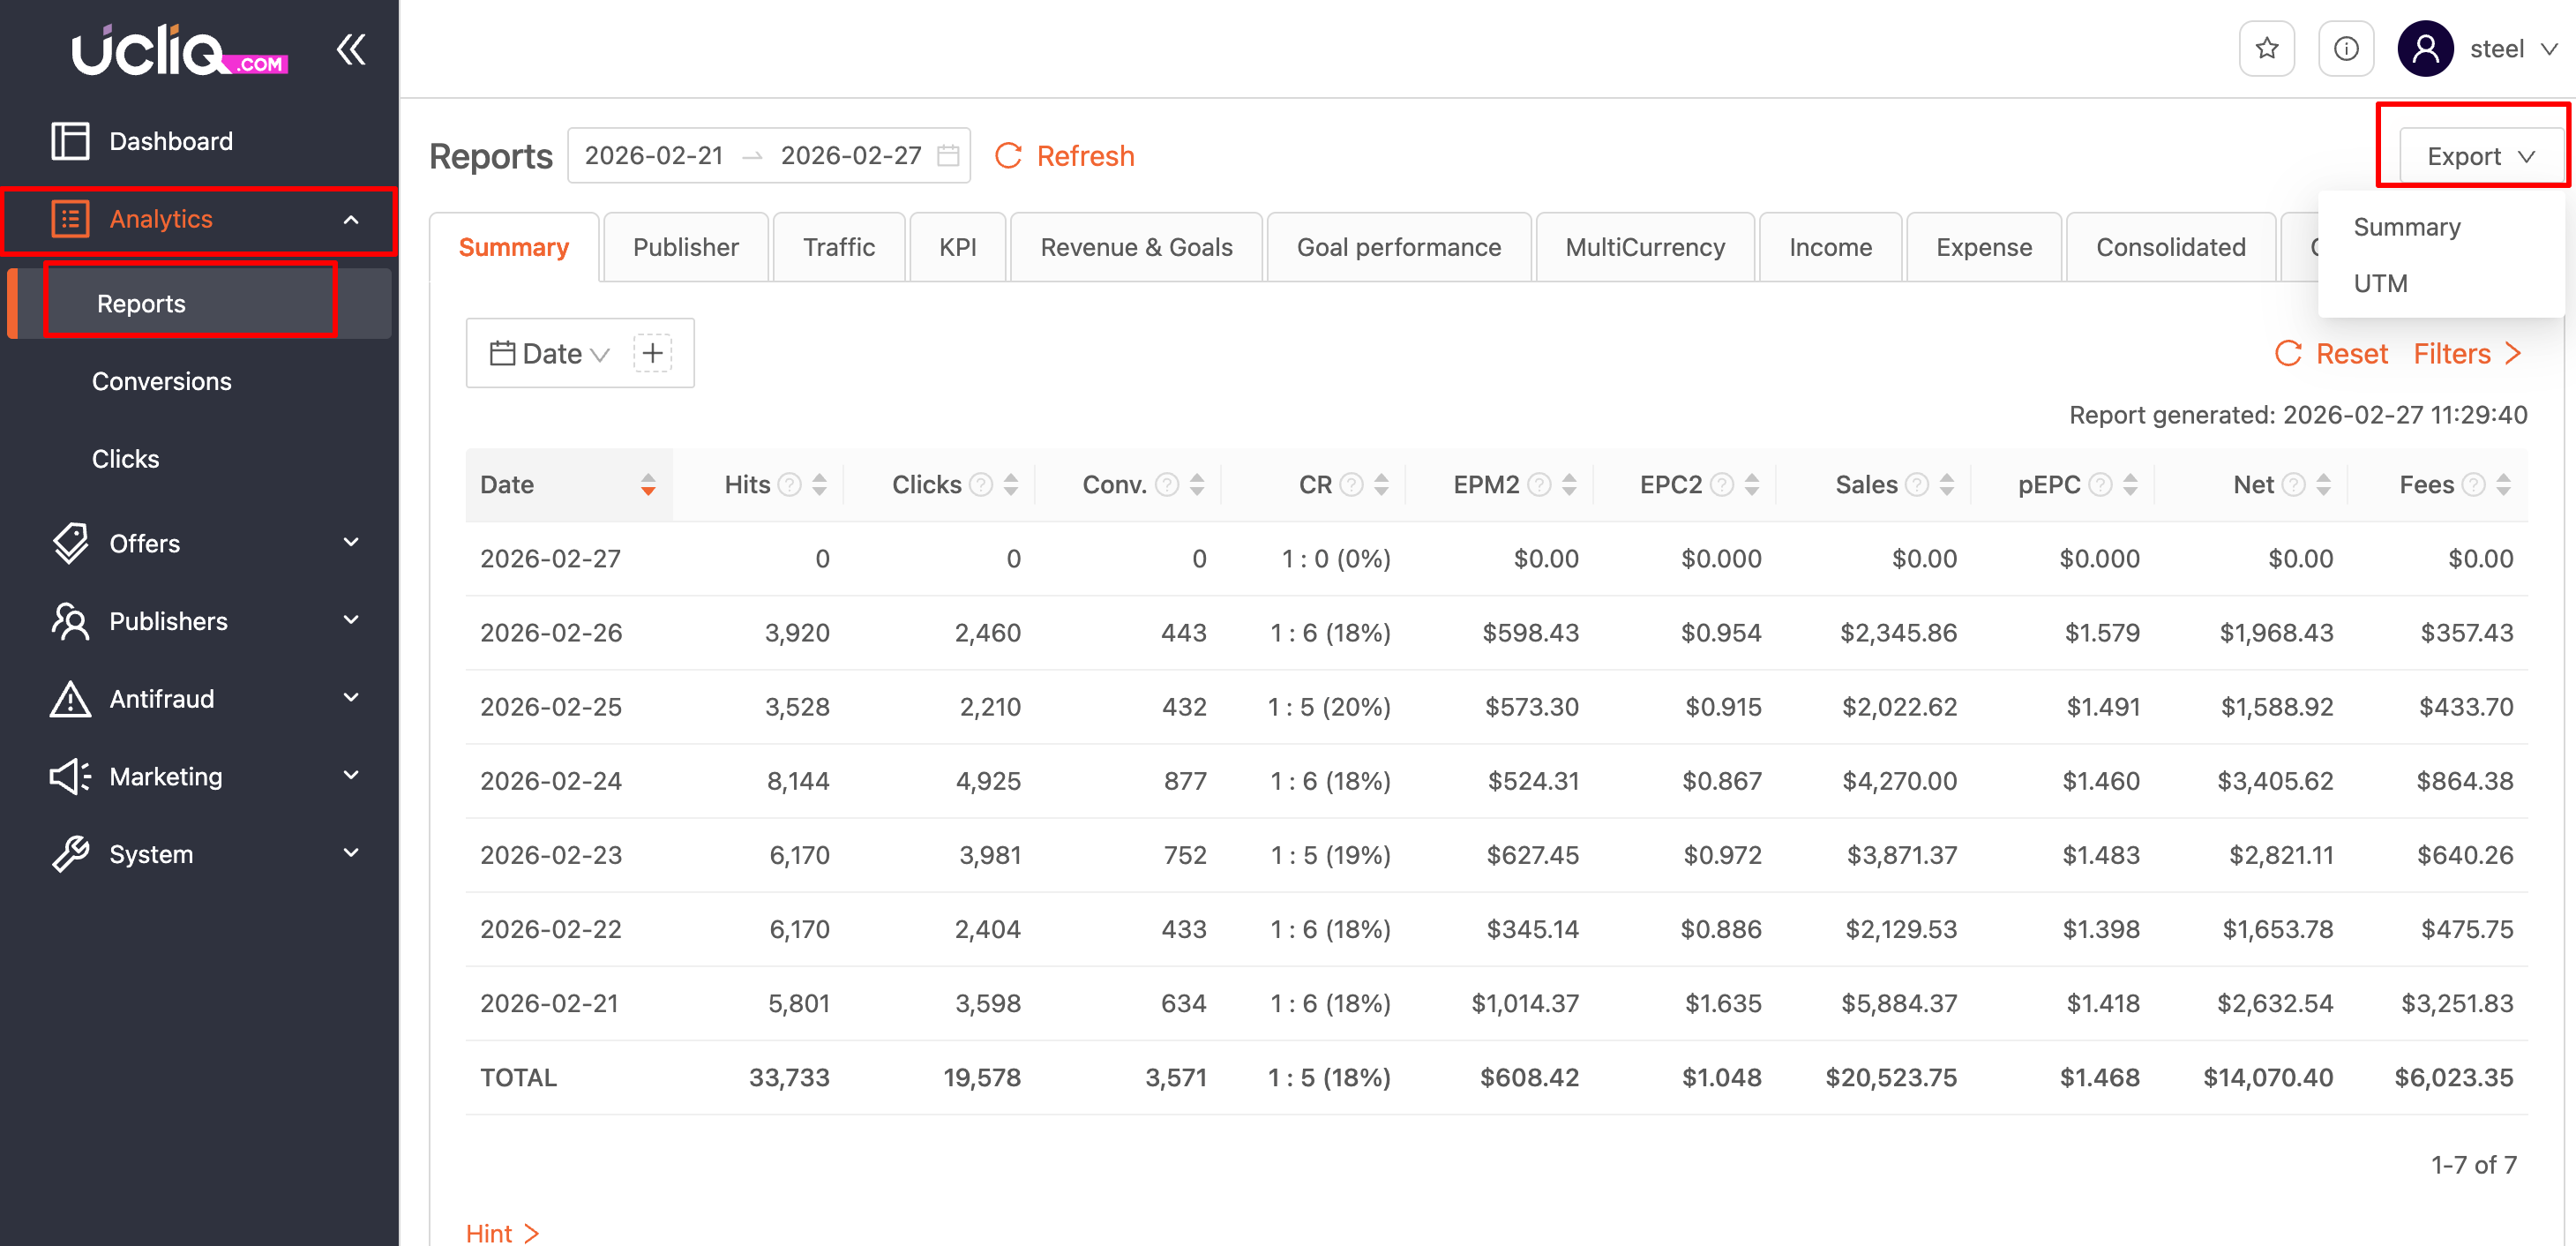
Export
The Export feature allows you to download your statistics in CSV format. You can choose from two export options:
-
General report
-
UTM traffic sources (for analyzing advertising campaigns)