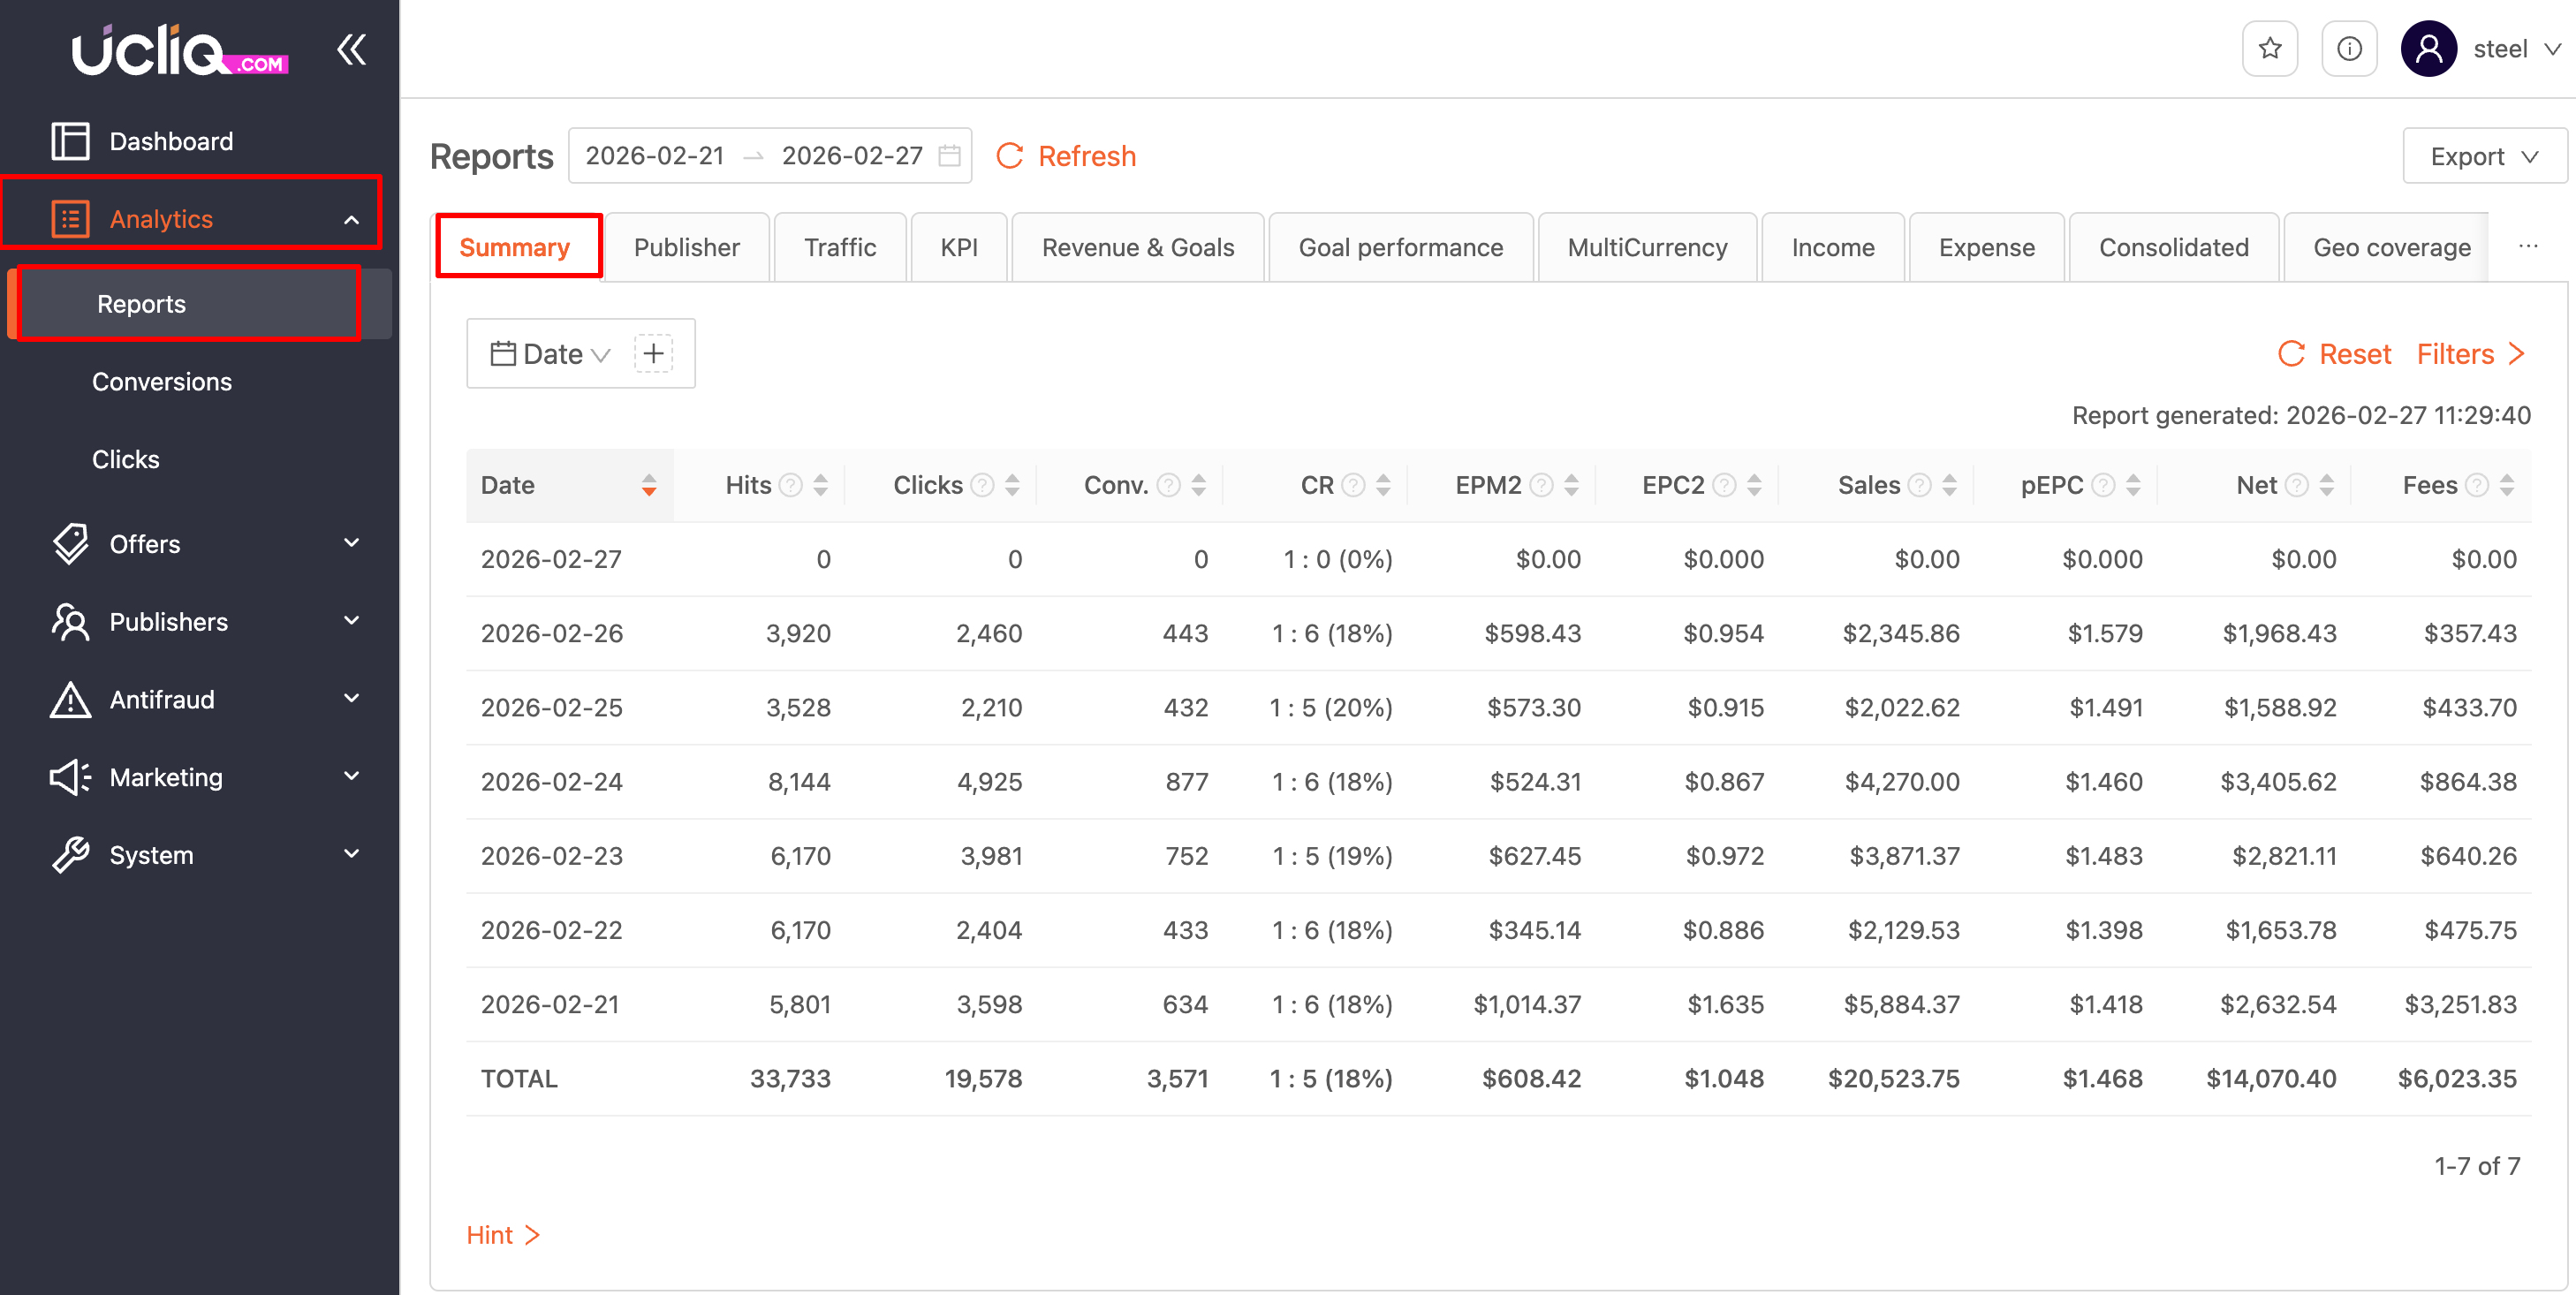
The summary report gives you an overview of your company’s key performance indicators. Here’s what you’ll find in it:
Data fields:
-
Events
Date: the date or time when the event took place
Hits: the number of impressions (clicks on publishers' tracking links)
Clicks: the total number of clicks on the link that led to a visit to the offer page
Conv.: the number of sales events that happened, such as CPS, CPC, etc. by conversion date
Leads: the number of leads received (CPL conversions, including all conversions with a $0.00 amount)
-
KPI indicators
CR (Click Rate): the average number of clicks per conversion
pEPC: the average income for unique clicks paid to publishers
EPC2: the average income for each click
EPM2: the average earnings per 1000 impressions
Reports also support multi-aggregation, so you can group data by different parameters. You can aggregate by:
-
Summary
-
Publisher
-
Traffic
-
KPI
-
Revenue & Goals
Financial indicators:
Sales: the total amount of sales received from the postback (only conversions, excluding declines and adjustments)
Net: publisher’s income, calculated as all conversions minus declines and adjustments
Fees: the commissions the company earns from conversions, including referrals, minus the total payouts to publishers
Notes:
-
Hits and Clicks are counted based on when the event occurred.
-
Conversions, EPC2, and EPM2 are calculated based on completed conversions (meaning the number of conversions will be added to the total on the day or hour they occurred).