Fraud Monitoring Dashboard Overview
The Fraud Monitoring section provides a high-level overview of suspicious activity related to your conversions. It is designed to help you quickly detect and assess fraudulent traffic patterns and take necessary actions to protect your campaigns.
This dashboard includes key data visualizations and indicators that show:
-
How many conversions were approved or declined
-
What types of fraud signals were detected
-
Which offers or countries may be affected
You can select a custom date range or use predefined filters (e.g. last 7 days, today, last 30 days, etc.) to view the data.
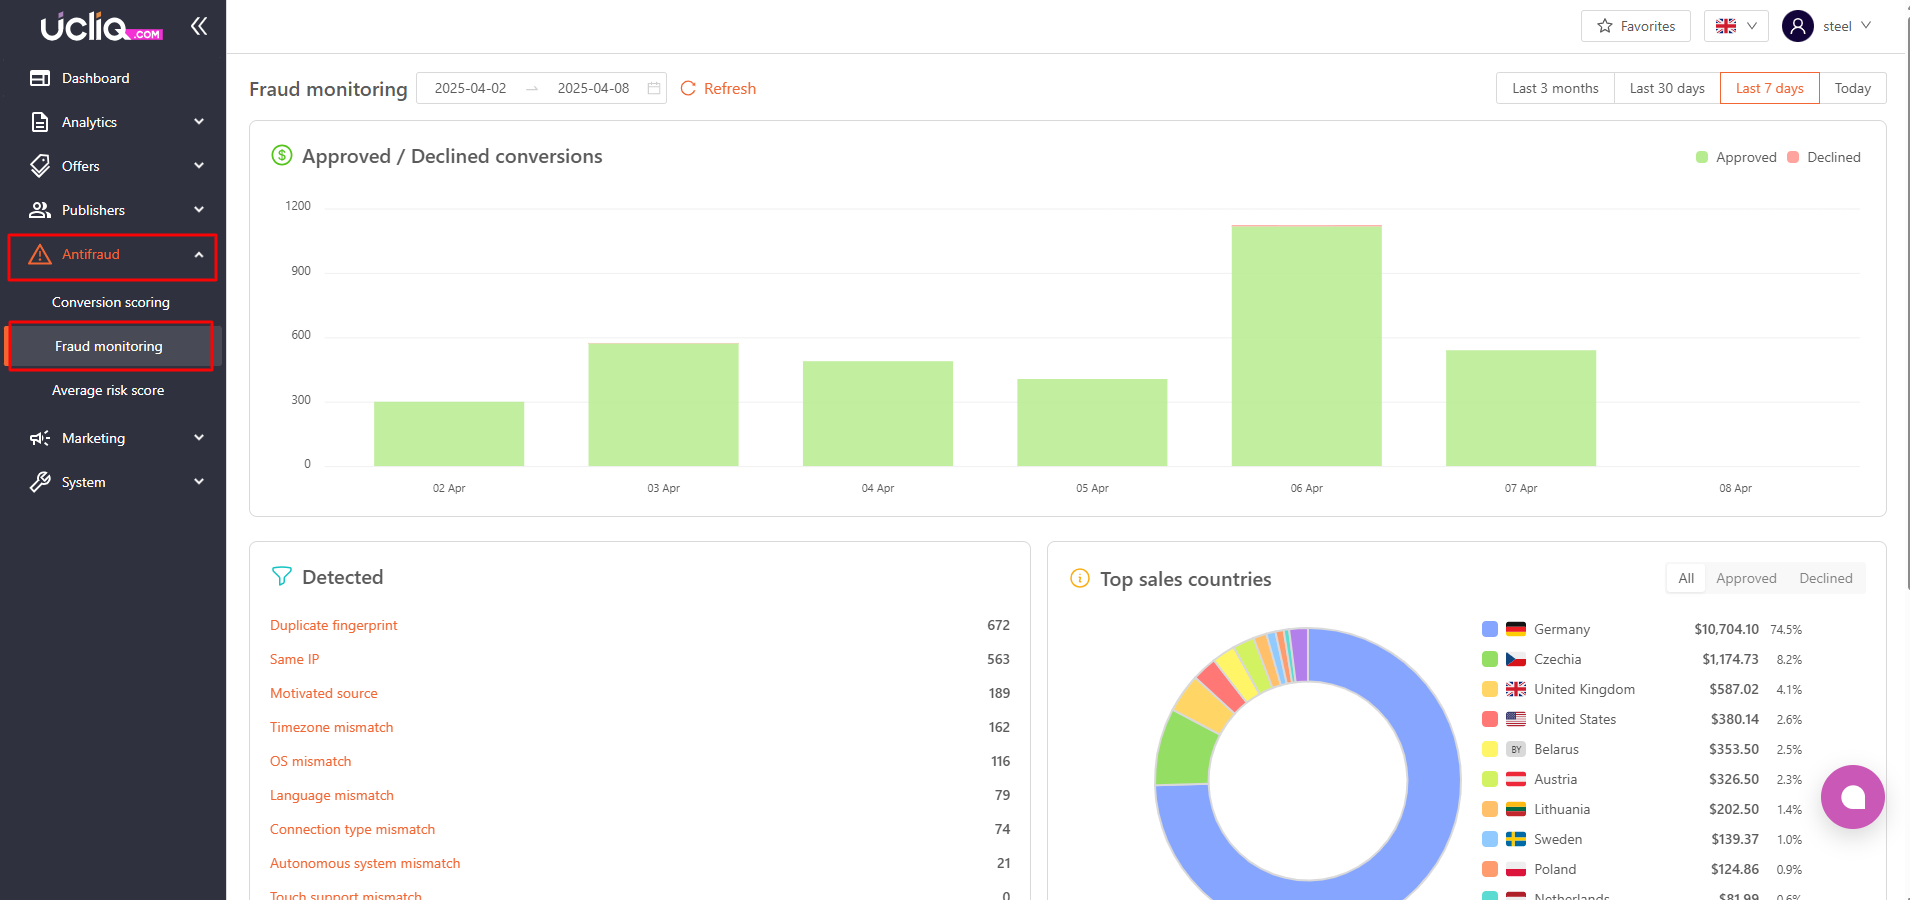
Approved / Declined Conversions
At the top of the dashboard, there is a line graph that shows the number of approved (green) and declined (red) conversions over the selected period.
This helps you monitor trends in traffic quality. A sudden increase in declined conversions may indicate fraudulent activity that requires further investigation.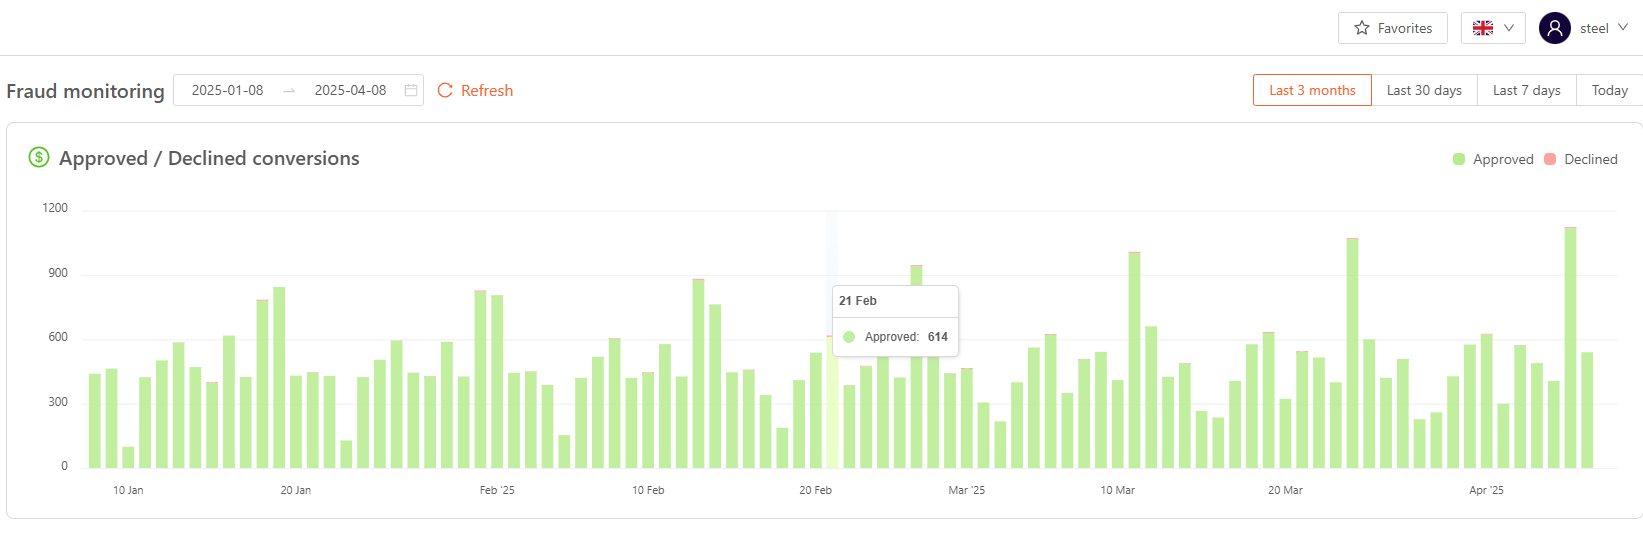
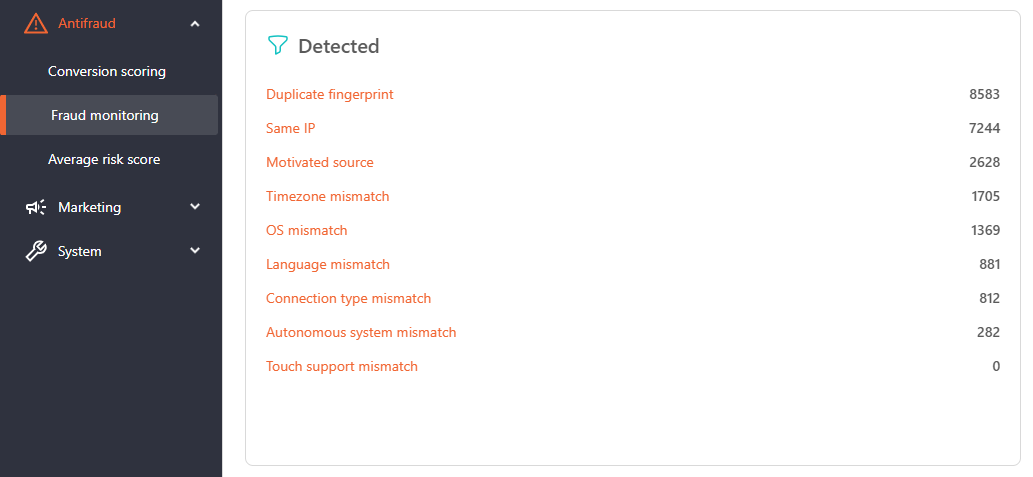
Detected Fraud Indicators
This section displays a list of fraud detection triggers, each showing how many times a specific pattern has been flagged in the selected period.
Here are the fraud signals explained:
-
Autonomous system mismatch – Traffic may originate from known data centers, often associated with bot activity.
-
Connection type mismatch – The internet connection type does not align with typical user behavior (e.g. unexpected proxy or VPN use).
-
Duplicate fingerprint – The same device fingerprint appears across multiple conversions.
-
Language mismatch – The user’s device language does not match the expected language for the offer’s target region.
-
Motivated source – Traffic appears to be incentivized, which may lower conversion quality.
-
OS mismatch – The user’s device operating system is inconsistent with expected values, often a sign of emulated devices.
-
Same IP – Repeated use of the same IP address for conversions, which may indicate automated or fraudulent activity.
-
Timezone mismatch – The user’s time zone does not match the geo targeted by the offer.
-
Touch support mismatch – The system detects that a device does not support touch input, which may suggest the use of a desktop emulator.
These indicators help you understand why certain conversions are being flagged and what type of fraud may be occurring.
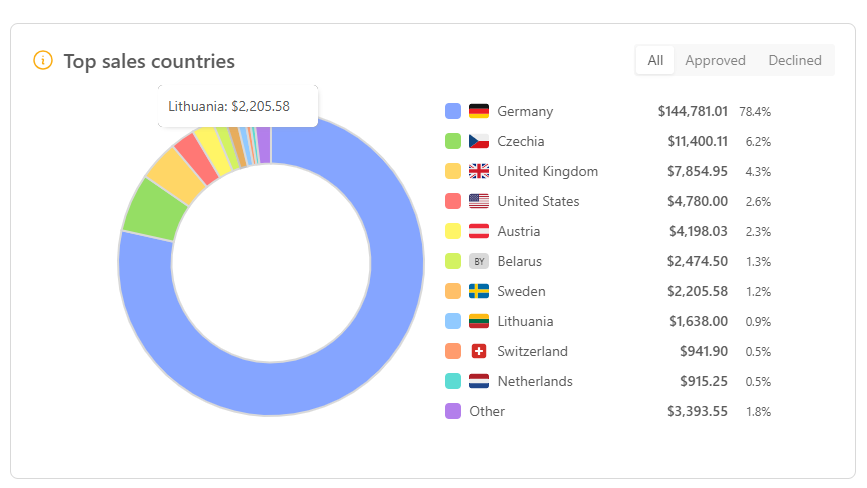
Top Sales Countries
This section includes a visual breakdown of traffic by country, shown as a circular chart. You can filter the view to display:
-
All traffic
-
Only approved conversions
-
Only declined conversions
This helps you identify which regions may be associated with suspicious activity.
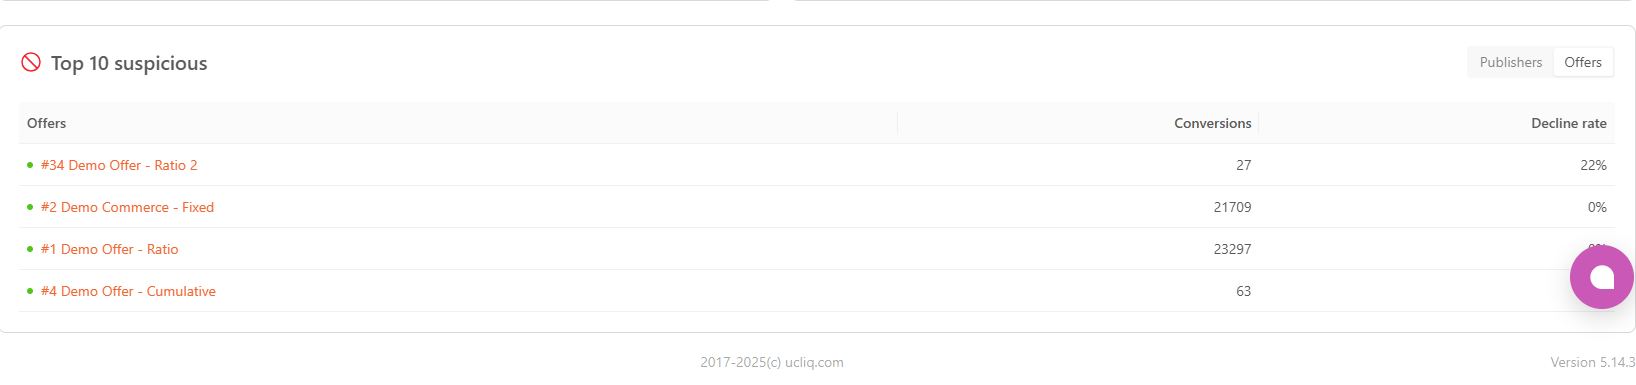
Top 10 Suspicious Offers
At the bottom of the dashboard, you’ll find a table listing up to ten offers with the highest levels of suspicious activity.
You can switch between viewing:
-
Offers with high fraud rates
-
Publishers involved in these conversions
This section is useful for prioritizing which offers or partners to review more closely.
The Fraud Monitoring dashboard helps you:
-
Monitor traffic quality over time
-
Understand the reasons conversions are being declined
-
Detect patterns of fraud by region, offer, or partner
-
Take timely action, such as blocking traffic sources or applying stricter conversion checks
It is recommended to check this dashboard regularly to ensure ongoing traffic quality and campaign